A Cheaper Night Out, Movie and Concert Ticket Prices Fell Five Months Running Before October’s Uptick
Federal price data shows admission to movies, theaters and concerts slid 3.3 percent from April to September, the steepest such drop in a decade.
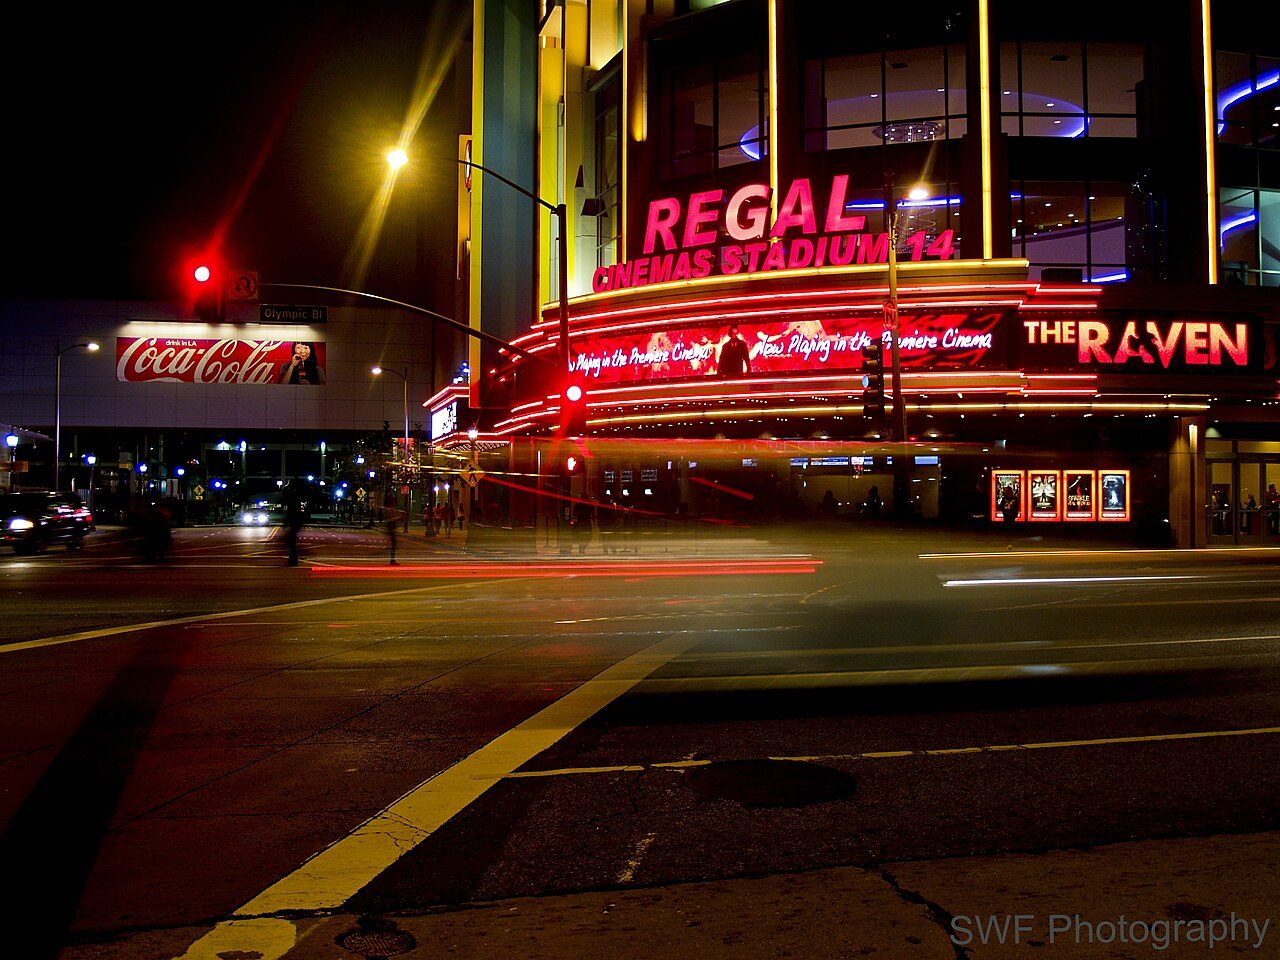
The price of a ticket to a movie, a play or a concert fell for five straight months in 2026, from May through September, before rising 0.4 percent in October, according to the Consumer Price Index the Bureau of Labor Statistics released on Tuesday, November 10.
The index for admission to movies, theaters and concerts peaked in April at 246.508 and dropped to 238.383 by September, a decline of 3.3 percent. In October it stood at 239.283. From April to September the index for everything urban consumers buy rose 1.2 percent. For a city that sells a lot of nights out, from the multiplexes at L.A. Live to the Hollywood Pantages, that is a rare stretch when going out got cheaper while nearly everything else did not.
How Unusual Is a Summer Price Drop
Unusual in its size, if not its direction. Ticket prices often soften between spring and early fall, but rarely by this much. Our table compares April with September for each of the last ten years, using the bureau’s index as published by the Federal Reserve Bank of St. Louis.
| Year | April index | September index | Change, April to September |
|---|---|---|---|
| 2017 | 177.536 | 180.337 | up 1.6 percent |
| 2018 | 180.992 | 183.286 | up 1.3 percent |
| 2019 | 184.811 | 186.828 | up 1.1 percent |
| 2020 | 188.129 | 187.431 | down 0.4 percent |
| 2021 | 193.202 | 195.781 | up 1.3 percent |
| 2022 | 204.389 | 206.917 | up 1.2 percent |
| 2023 | 218.441 | 218.054 | down 0.2 percent |
| 2024 | 225.907 | 223.677 | down 1.0 percent |
| 2025 | 233.593 | 232.612 | down 0.4 percent |
| 2026 | 246.508 | 238.383 | down 3.3 percent |
Velvet Hollywood’s calculation from the Bureau of Labor Statistics index for admission to movies, theaters and concerts, U.S. city average, not seasonally adjusted, December 1997 equals 100.
Before 2023, summer usually meant a small increase. Since then the index has dipped between April and September every year, and 2026’s drop is more than three times the size of the next largest, 2024’s 1.0 percent. Even 2020, when theaters and arenas were closed and there was little to price, saw only a 0.4 percent dip.
The monthly path this year ran up and then down. The index fell 0.7 percent in January, climbed 0.7, 1.1 and 0.4 percent in February, March and April, then fell 0.4, 1.0, 0.4, 0.6 and 0.8 percent from May through September before October’s 0.4 percent rise. The bureau’s own October table shows the same 0.4 percent October increase on a seasonally adjusted basis, after declines of 0.6 percent in August and 0.8 percent in September.
Have Tickets Kept Up With Inflation
Not over the last decade. Octobers are the cleanest comparison, with one gap. The bureau published no October 2025 index, and its table notes that “The Oct 2025 data values are not available due to the 2025 lapse in appropriations.” So the 2026 row below compares with October 2024.
| October of | Admission index | Change | All items index | Change |
|---|---|---|---|---|
| 2016 | 174.305 | 241.729 | ||
| 2019 | 188.214 | up 8.0 percent in three years | 257.346 | up 6.5 percent in three years |
| 2022 | 208.790 | up 10.9 percent in three years | 298.012 | up 15.8 percent in three years |
| 2024 | 225.679 | up 8.1 percent in two years | 315.664 | up 5.9 percent in two years |
| 2026 | 239.283 | up 6.0 percent in two years | 337.511 | up 6.9 percent in two years |
Velvet Hollywood’s comparison of the admission index and the all items index, both not seasonally adjusted. The two indexes use different base periods, so compare the percentage changes, not the levels.
From October 2016 to October 2026, admission prices rose 37.3 percent and overall prices 39.6 percent. Since October 2019, the last fall before the pandemic, admission is up 27.1 percent against 31.2 percent for all items. The gap is not large, but it runs one way. A night at the movies or a concert has become slightly cheaper relative to everything else.
The longer record points the other direction. Since the admission index began at 100 in December 1997, it has risen 139.3 percent, while the all items index rose from 161.3 to 337.511, or 109.2 percent. Tickets got relatively more expensive for two decades and have given a little back since.
Staying home has not been a bargain either. The index for cable, satellite and live streaming television service rose 40.3 percent from October 2016 to October 2026, a little faster than tickets.
What the Index Does and Does Not Measure
The admission index tracks what people pay to get in the door at movie theaters, live theater and concerts across U.S. cities. It is a national number for the U.S. city average, so it cannot say whether tickets in Hollywood moved more or less than tickets elsewhere. It also measures price, not attendance.
Hollywood’s own ledger has been moving the other way. The domestic box office was days from passing its full 2025 total by mid November, with Paramount’s Ebenezer, the latest in a long line of Christmas Carol films, opening on Friday, November 13. Whether softer prices helped sell more tickets is a question the index alone cannot answer.
How We Calculated
We downloaded the not seasonally adjusted series CUUR0000SS62031, CPIAUCNS and CUUR0000SERA02 from FRED on November 13, 2026, after FRED updated them on November 10, and checked the October monthly changes against the bureau’s published table. Percent changes are our arithmetic from index levels, rounded to one decimal. October 2025 is missing in every series, so year over year changes for October 2026 cannot be computed.
The November index is scheduled for release on Thursday, December 10, 2026, and it will be the first to include the full holiday movie season.